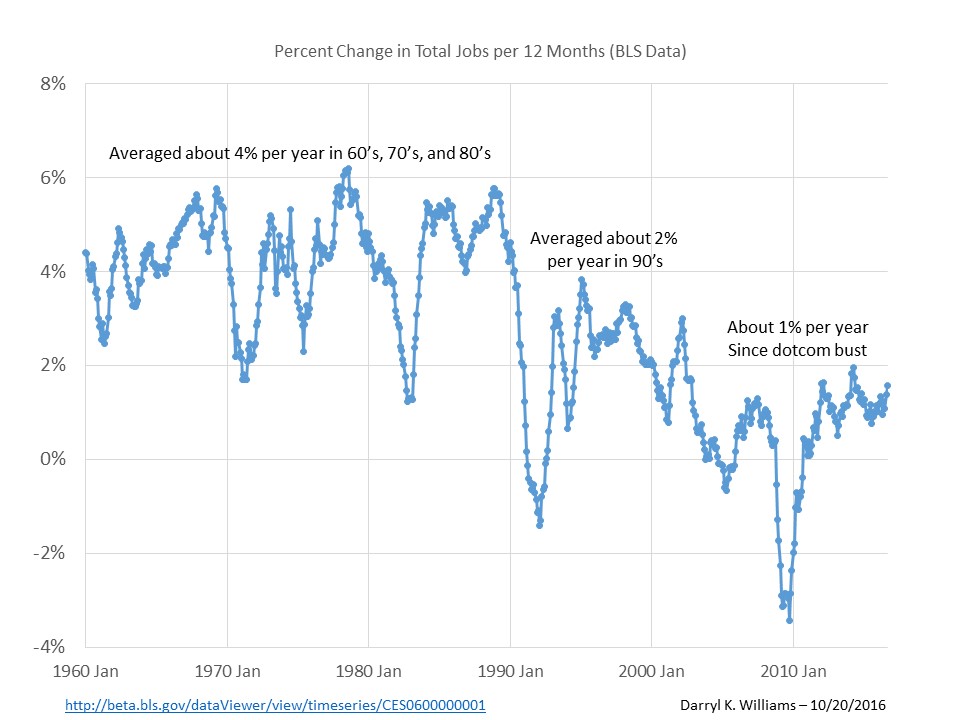
Both sides of the political fence like to pick and choose data points to prove either that the jobs recovery during the Obama administration is miraculous and record setting or dismal and regrettable. I object to all attempts to use the data to lie in pursuit of votes and to hide the important issues such as the long term trend in job growth in the USA. And by “long term,” I mean 50 plus years. Below is the chart for 1960 to today. For each month, the percent change in total jobs for the previous 12 months is plotted. All the data are published by the US Bureau of Labor Statistics, though I’m not aware of anyone else creating this particular chart from that data.
Back to politics. Folks who want to brag on President Obama pick that low point in December 2009 and point to the rise from then. Folks who want to criticize the president pick a point right at the end of the Bush administration and say that job growth has averaged only about 1% since then, lower than the average during the Bush administration. But here is the truth, the whole truth, and nothing but the truth.

I toyed with putting the Presidential terms on the chart just to prove that the long term trends are pretty much independent of whoever happens to be president but decided that would be a waste of time. In spite of the fact that Mitt Romney and Barack Obama agreed during their competition for the top job that government doesn’t “create” jobs, many citizens continue to agree with the NYTimes that government is the key and aren’t likely to be swayed by data. Key points can always be picked to back ones opinion. Government can make a difference, but not if strategy changes every four or eight years.
A sobering obvious truth in the above chart is the periodic occurrence of new lows, early 60’s, early 70’s, early 80’s, early 90’s, and late 2000’s. The long time span between the last two new lows was tempered by the destructive federal stimulation of the real estate market which resulted in the inevitable crash, which, by pure chance, happened in the last year of the Bush administration, and the following major new low in jobs growth.
The reasons for the long term decreasing trend are well documented: End of cheap oil in the 1970’s, rise of Germany and Japan following recovery from WWII, economic development of China and India, automation, globalization, and information technology. Those trends have eliminated the monopoly on the global economy that the US enjoyed in the 1950’s and 1960’s while creating incredible new opportunities for the educated, motivated, and creative citizens of that same country, even as job opportunities for the less educated, the less motivated, and the less creative have done a slow disappearing act. And the timing of those new lows and the sizes of the recoveries from them are matters of chance and independent of whoever happens to be in political power at the time.
The United States could have responded more appropriately to these challenges. It could have focused on attracting productive businesses with low tax rates, lower inflation, lower compensation, and helpful regulation rather than on borrowing to maintain a falsely high prosperity and pay ever increasing social benefits. Vote acquisition was easier in a system that paid a lot less for no work than one that paid a little less for more work. And so the work and associated jobs keep decreasing.
Will there be a change in the trend? I don’t believe so. Look for a MAJOR new low in job growth sometime in the next fifteen or so years. And go ahead and feel sorry for whoever happens to be president at the time and congratulate whoever happens to follow him or her for enjoying and bragging about the inevitable recovery to a lower high.