Once we get past the major peripheral presidential campaign issues currently dominating social and left and right wing media, there are three subjects that deserve our careful attention: Immigration, Trade, and Health Care Legislation. The focus of this post is immigration.
First, let us admit that we have committed terrible sins looking the other way as immigrants flocked to the USA without being forced to check in and identify themselves. We did that because we have enjoyed their cheap labor harvesting our crops and building our homes and caring for our lawns and children. We are now paying the price as we risk dangerous immigrants crossing leaky borders and argue over what to do about those potential good citizens currently under the radar and in violation of the law.
It is a sorry history and a bad situation. I suggest that any discussion of policy changes should be based on some understanding of the history of immigration to the USA and of legislation directed at it. After all, even the ancestors of so-called full-blooded Native Americans are believed to have immigrated here eons ago.
Here is a quick summary of legislation mileposts. It is interesting to think about motivation for some of the changes. There are a couple of more extensive histories here and here, sometimes including comments on the reasons behind the legislation.
- 1790 – Two year residency required for naturalization
- 1795 – Residency requirement increased to five years
- 1798 – Residency requirement increased to fourteen years
- 1802 – Residency requirement reduced to five years
- 1843 – Attempt to raise residency requirement to 25 years failed
- 1870 – “Aliens of African nativity” allowed to become citizens
- 1875 – Prostitutes and Convicts not allowed
- 1882 – Chinese immigration curbed; Also lunatics, idiots, persons likely to become public charges; $0.50 tax on new arrivals.
- 1885 – Contract laborers banned
- 1888 – Provision for expulsion of aliens added
- 1903 – Polygamists and political radicals excluded
- 1907 – Those with physical or mental defects, tuberculosis, children unaccompanied by parents excluded; Japanese restricted
- 1917 – Illiterates, persons of psychopathic inferiority, alcoholics, stowaways, vagrants, people, men and women, entering for immoral purposes excluded
- 1921 – Quotas established by nationality
- 1943 – Agricultural workers allowed; Chinese exclusion repealed
- 1946 – Foreign born spouses, fiancés, children of US armed forces personnel allowed
- 1948 – Persons fleeing persecution allowed for first time
- 1950 – Deportation of Communist Party members allowed
- 1966 – Cubans allowed citizenship after two years residency
- 1986 – Persons who entered illegally allowed to gain legal status
- 1990 – Annual limit of 700,000 immigrants established
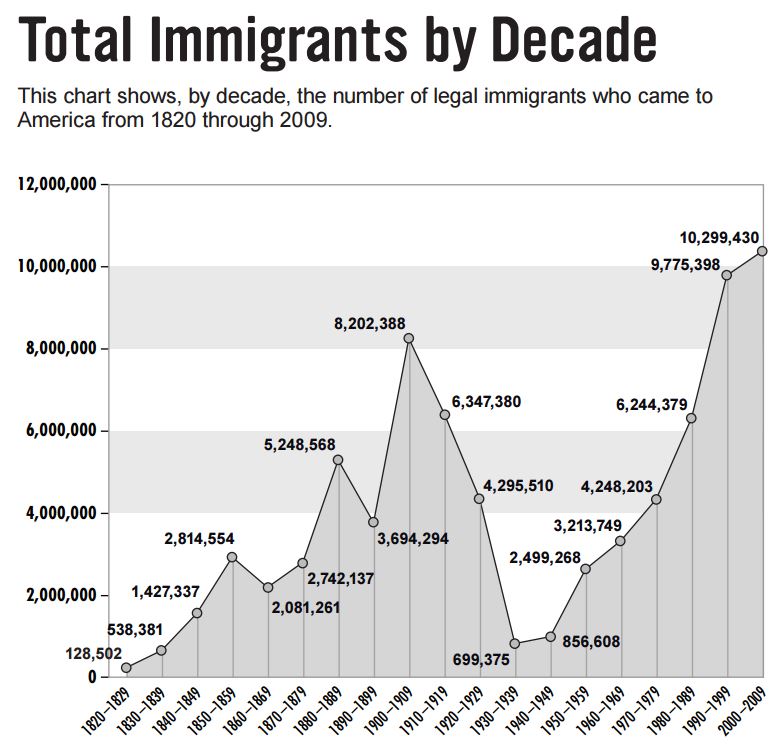
And here is a nice chart of total immigrants by decade. This is legal immigrants only. It is available here.

I have written earlier about walls and bridges, both of which I believe we need. Whether the walls are physical or electronic, we need some way to restore the integrity of our borders while at the same time allowing and encouraging immigrants who will support our Constitution and Flag to sign up and come on in. If the goal is to change our way of life, send them back.
Oh, and in case you haven’t been keeping up with social and left and right wing media, those peripheral issues I mentioned are:
- Whether Mrs. Clinton has a terminal illness and is dying as we watch.
- Whether Mrs. Clinton should be in prison along with others who mishandled classified information.
- Whether Mrs. Clinton has granted access to individuals in return for money.
- Whether Mr. Trump is just building his brand and has no desire to be POTUS.
- Whether Mr. Trump’s ego will be the cause of our next global war.
- Whether Mr. Trump forgets from one day to the next what he has said.
So far as I can tell at this point, only one of the six “whethers” has a clearly positive answer.
_______________________________________
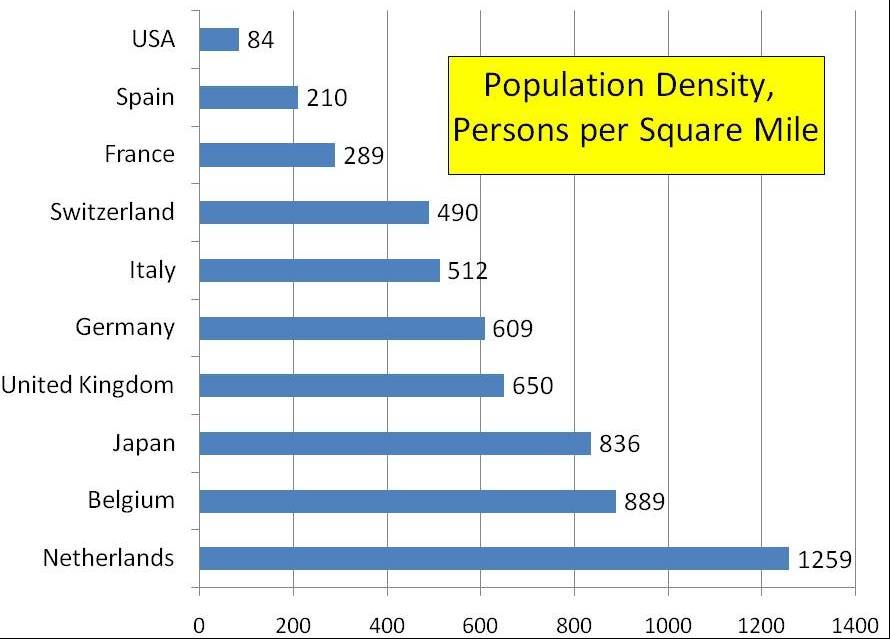
Note: I am adding this population density chart in response to the comment about immigration as a percent of population being still well below what it was at the previous peak.
